![[Experimental]](figures/lifecycle-experimental.svg)
plot() aggregates and plots continuous samples as violin or density plot.
Usage
# S3 method for class 'cont_sample'
plot(
  x,
  var,
  ...,
  group = FALSE,
  type = "violin",
  title = NULL,
  xlab = "",
  ylab = "",
  colours = NULL,
  line_width = 0.7,
  family = "sans",
  expert_names = NULL,
  theme = NULL,
  beeswarm_cex = 0.6,
  beeswarm_corral = "none"
)
Arguments
- x
n object of class
cont_samplecreated by the function cont_sample_data.- var
character string with the name of the variable to be plotted.
- ...
Unused arguments, included only for future extensions of the function.
- group
logical, if
TRUEdata are aggregated by expert.- type
character string with the type of plot, either beeswarm or violin or density.
- title
character string with the title of the plot.
- xlab
character string with the x-axis label.
- ylab
character string with the y-axis label.
- colours
character vector with the colours to be used in the plot.
- line_width
numeric with the width of the lines in the density plot.
- family
character string with the font family to be used in the plot.
- expert_names
numeric or character, the labels for the experts.
- theme
themefunction to be used in the plot.- beeswarm_cex
numeric, the space between points in the beeswarm plot.
- beeswarm_corral
character string, the wrapping corral for the beeswarm plot. Anything accepted by the geom_beeswarm function.
Value
Invisibly a ggplot object.
See also
Other plot helpers:
plot.cat_sample(),
plot.elic_cont()
Examples
# Create the elict object and add data for the first and second round from a
# data.frame.
my_elicit <- cont_start(var_names = c("var1", "var2", "var3"),
var_types = "ZNp",
elic_types = "134",
experts = 6) |>
cont_add_data(x, data_source = round_1, round = 1) |>
cont_add_data(data_source = round_2, round = 2)
#> ✔ <elic_cont> object for "Elicitation" correctly initialised
#> ✔ Data added to "Round 1" from "data.frame"
#> ✔ Data added to "Round 2" from "data.frame"
# Sample data for the first round for all variables
samp <- cont_sample_data(my_elicit, round = 1)
#> Warning: ! Some values have been constrained to be between 0 and 1.
#> ✔ Rescaled min and max for variable "var3".
#> ✔ Data for "var1", "var2", and "var3" sampled successfully using the "basic" method.
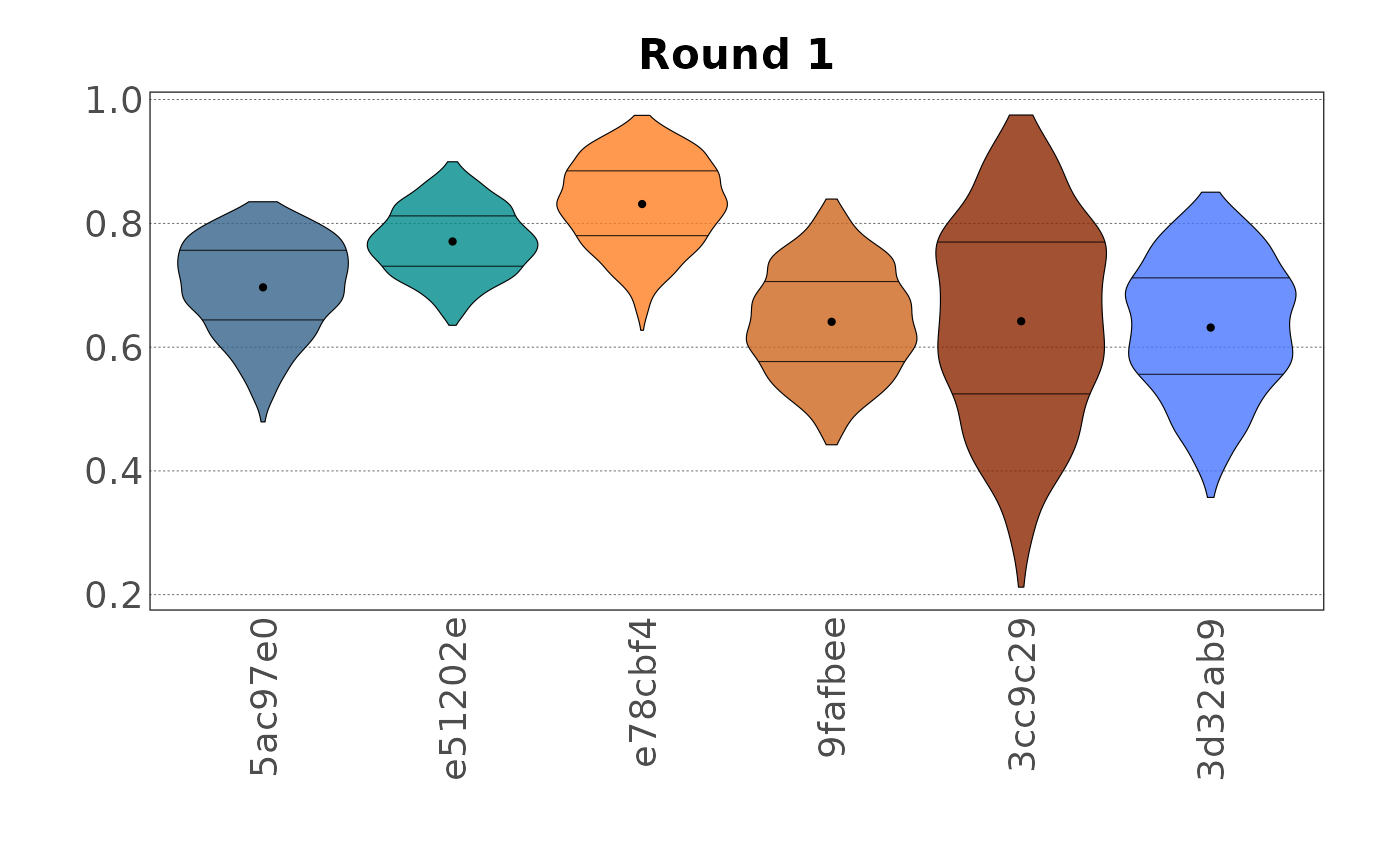
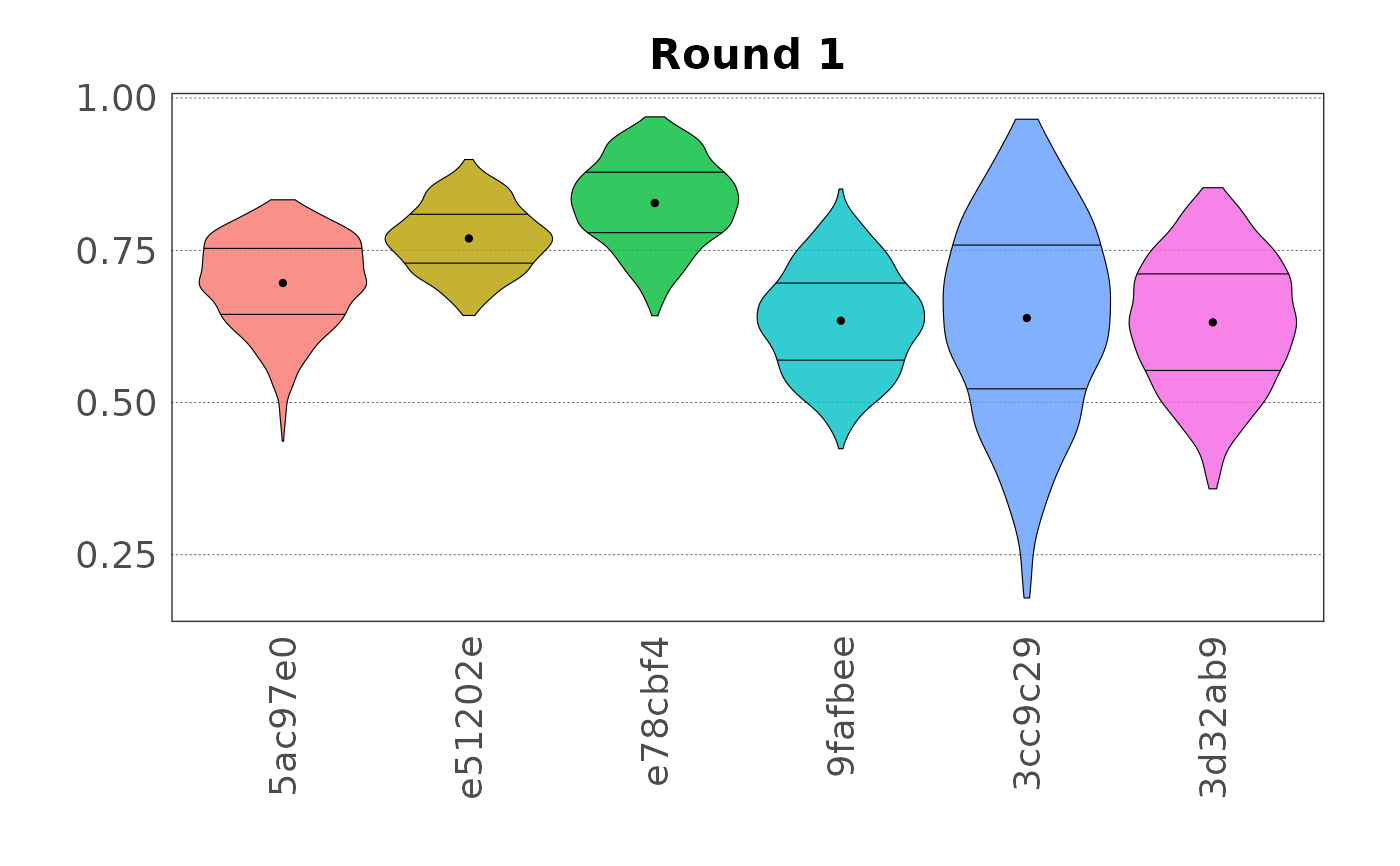
# Plot the sampled data for the variable `var3` as violin plot
plot(samp, var = "var3", type = "violin")
 # Plot the sampled data for the variable `var1` as beeswarm plot
plot(samp, var = "var1", type = "beeswarm")
# Plot the sampled data for the variable `var1` as beeswarm plot
plot(samp, var = "var1", type = "beeswarm")
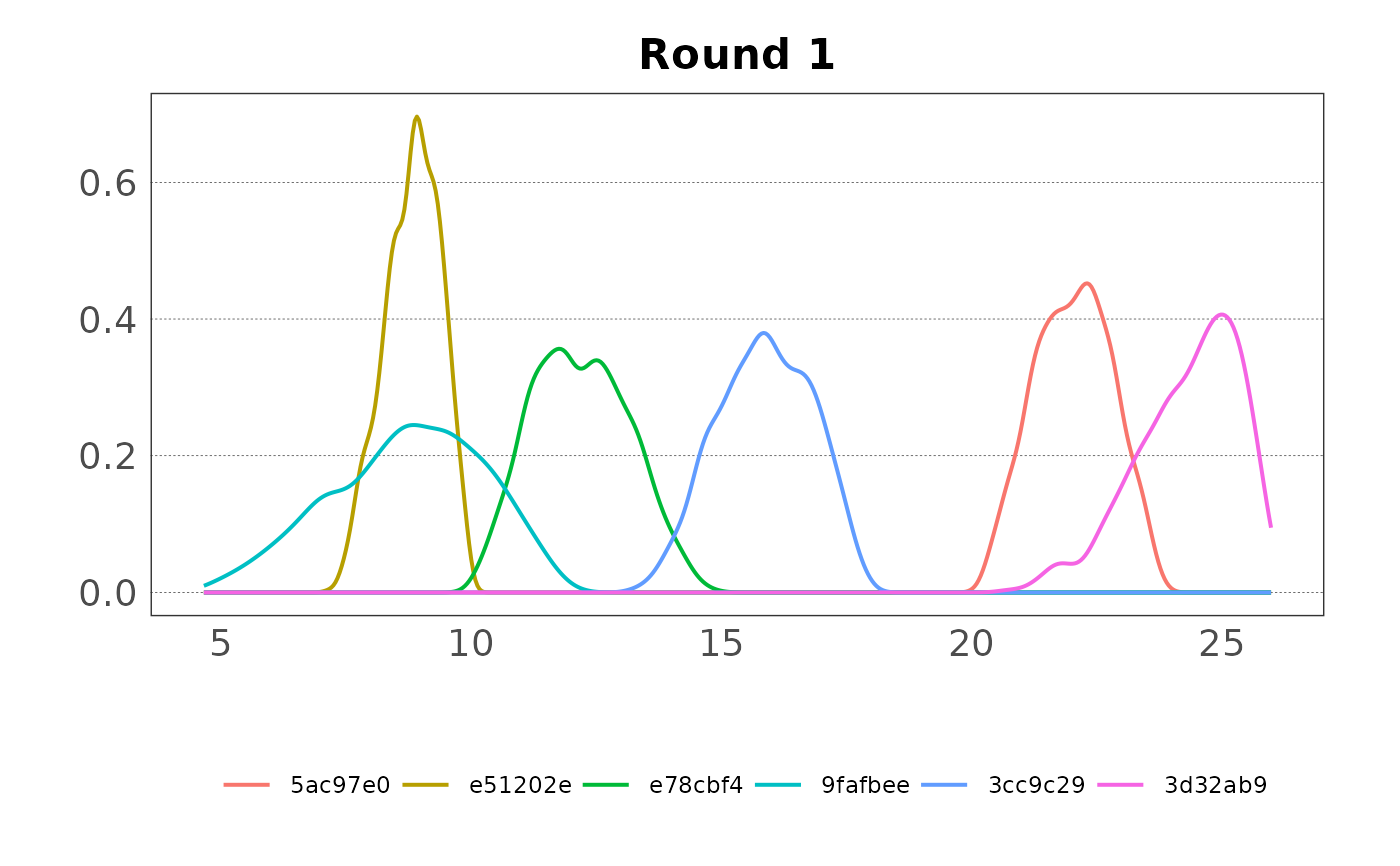 # Plot the sampled data for the variable `var2` as density plot
plot(samp, var = "var2", type = "density")
# Plot the sampled data for the variable `var2` as density plot
plot(samp, var = "var2", type = "density")
 # Plot the sampled data for the variable `var1` as density plot for the group
plot(samp, var = "var1", group = TRUE, type = "density")
# Plot the sampled data for the variable `var1` as density plot for the group
plot(samp, var = "var1", group = TRUE, type = "density")
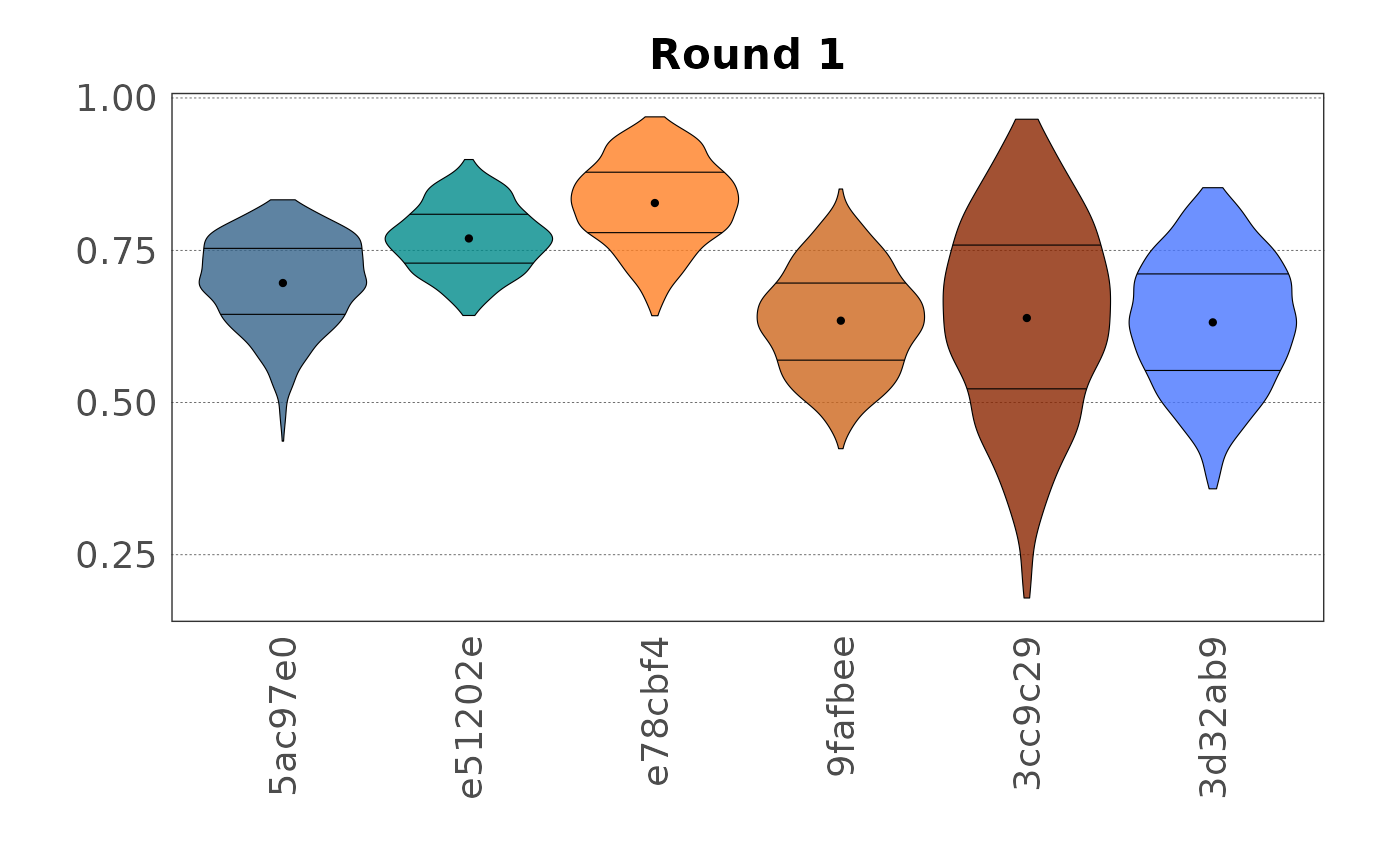 # Plot the sampled data for the variable `var3` as violin plot passing the
# colours
plot(samp, var = "var3", type = "violin",
colours = c("steelblue4", "darkcyan", "chocolate1",
"chocolate3", "orangered4", "royalblue1"))
# Plot the sampled data for the variable `var3` as violin plot passing the
# colours
plot(samp, var = "var3", type = "violin",
colours = c("steelblue4", "darkcyan", "chocolate1",
"chocolate3", "orangered4", "royalblue1"))